
Weather and Climate
Type of resources
Topics
Keywords
Contact for the resource
Provided by
Years
Formats
Representation types
Update frequencies
status
-
The dataset contains the blended (gauge and satellite estimates) monthly mean precipitation rates (unit: mm/day) for Canada for the period from January 1979 to December 2007, at a half degree spatial resolution. Please refer to the paper below for the details of the blending algorithm and input gauge and satellite data. Reference: Lin, A. and X. L. Wang, 2011: An algorithm for Blending Multiple Satellite Precipitation Estimates with in-situ Precipitation Measurements in Canada. JGR-Atmospheres, 116, D21111, doi:10.1029/2011JD016359.
-
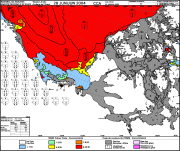
The Canadian Ice Service maintains a collection of Daily ice charts, Regional ice charts and Iceberg charts. These charts are available in GIF format and E00 (Regional Charts only).
-
This daily forecast describes the ice edge using latitude and longitude coordinates, the total ice concentration, the predominant ice stage of development and the concentration of the oldest ice type. Warnings are issued as appropriate. The forecasts are valid from the time of issue until the end of the following day (so for a period of 24 to 48 hours).
-
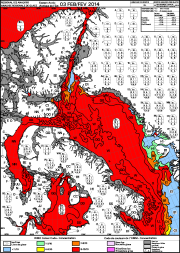
These ice charts illustrate ice conditions at a particular moment in time. The ice information is presented using a standard international code, known as the Egg Code. The following charts are available from the Canadian Ice Service: -Daily Ice Charts -Image Analysis Ice Charts -Regional Ice Charts
-
The data consists of temperature indices based on homogenized daily maximum and minimum temperatures at 338 locations across Canada, and of precipitation indices based on adjusted daily rainfall, daily snowfall and daily precipitation amounts at 463 locations across the country. These indices were selected for their relevance to social and economic impact assessment in Canada and for the insights they could provide regarding changes in extreme climate conditions. Please refer to the papers below for detailed information regarding the adjustment procedures and the trends in the indices.
-
The Homogenized Surface Pressure data consist of monthly, seasonal and annual means of hourly sea level and station pressure (hectopascals) for 626 locations in Canada. Homogenized climate data incorporate adjustments (derived from statistical procedures) to the original station data to account for discontinuities from non-climatic factors, such as instrument changes or station relocation. The time periods of the data vary by location, with the oldest data available from 1953 at some stations to the most recent update in 2014. Data availability over most of the Canadian Arctic is restricted to 1953 to present. The data will continue to be updated every few years (as time permits).
-
This dataset contains blended (gauge and satellite estimates) pentad mean precipitation rates (unit: mm/day) at a one degree spatial resolution over Canada. The data can be used for hydrometeorological, agricultural, forestry modelling, for numerical weather model and climate model verification, and for climate impact studies.
-
Meteorological Observations describe datasets that contain information aboutweather and climate conditions as available on the City-Pages of the Environment Canada WeatherOffice.gc.ca web site. These pages contain information about current weather conditions and past climate including temperature, wind, and humidity measurements, written descriptions of current conditions, rain and snow amounts, average and extreme temperatures, etc. The current conditions are acquired from a variety of observing system operators and are provided in near-real time with limited quality assurance. Current condition information should not be considered as quality-controlled official values. The availability of values for every observation period is not guaranteed as they may be affected by observing system operations.